Data Visualization Projects
I have completed a number of different plotting programs, graphical transformations, differential potential plottings, fractal generation programs, and other mathematical simulations. I have also done some interesting animations of quantum chemistry equations in Mathematica (tm). Most of these programs have gone by the wayside either requiring customized hardware that no longer exists, or older operating systems that are no longer supported, or programs that have simply been lost.
Here are some data visualization programs I have authored. Going forward I must try to be better at archiving.
|
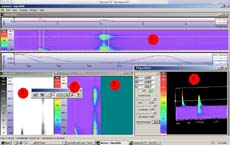
Aurora Project at Varian, Inc .This project was a very quick 3+ month labor that shows much better than the majority of PolyView Photodiode Array Analysis work that I did at Varian. I would frequently refer to this Aurora project as "eye candy", "boss-ware" or "demo-booth-ware" because in the end these pretty graphs in themselves have limited analytical value. As a primary display, and tool from which other analysis could be preformed, this interface would serve much better.More details on the Aurora Project. |
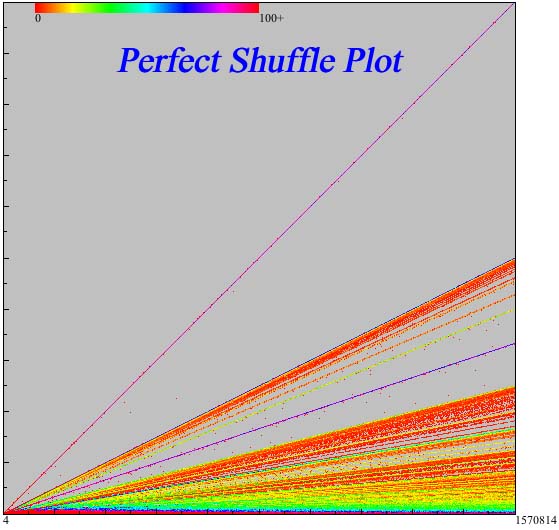 |
Stack Plot ProjectA scatter plotting is only useful if there are a sizeable number of points, but far few fewer data points than pixels. This particular program was done in Java to display the results of the first 750K even decks of cards when applying the perfect shuffle. Here 750K points can be displayed on a 512*512 (262K) pixel display because when multiple data points fall on the same pixel, that pixel advances in its color state. I liken it to stacking the data points. More details on the Stack Plot project. |
 |
Gdi Plus ExampleJust and example about what the Windows GDI plus graphics API can do with respect to pixel manipulation More details on the Gdi Plus Example |
home